

Short answer
- Ultrasound measures the remaining wall thickness of a pipe from the outside and from one side, with the plant in service.
- Corrosion isn't uniform: pitting is missed if you take a single reading per point. You have to scan each area and keep the minimum.
- Measuring at the same points every time, with their position recorded, shows how much wall is lost from one inspection to the next.
As well as measuring, the QS5 draws the thickness profile in real time as you slide the transducer (B-Scan) and warns you when the back wall is irregular, the typical sign of corrosion or pitting. And in its DLE version, it measures through paint.
What to look for: general loss and pitting
General corrosion
The wall thins more or less evenly. Spread spot readings detect it well, and what matters is the trend: how much wall is lost per year and how much margin remains to the minimum allowable thickness.
Pitting
Very localised losses, a few millimetres across, that can go through the wall while the rest of the pipe looks sound. They are the most dangerous and the easiest to miss: a reading two centimetres from a pit gives the nominal thickness.
That is why, on a corroded pipe, a measuring point is not a reading: it is an area you scan with the transducer, keeping the lowest value.
How to measure, step by step
- Prepare the surface. Remove loose rust and scale where the transducer will sit. If the pipe is painted and the paint is well bonded, you don't need to remove it with the QS5 DLE echo-echo mode (see the guide measuring through paint).
- Calibrate the zero and set the velocity of the pipe material (see the ultrasonic velocity guide). If the pipe is hot, calibrate at its temperature.
- Define a grid of points on the pipe, marked and numbered, especially at elbows, tees, reducers, low points and supports, which is where corrosion concentrates most.
- At each point, scan the area by sliding and slightly rotating the transducer, and keep the lowest reading. The QS5 holds it on screen together with the highest.
- Store each reading with its position (grid row and column) to compare it with the next inspection.

Problem 1: a pit between two readings
The symptom: the pipe passes inspection with every reading above the minimum and, months later, a leak appears.
Why it happens: a spot reading only measures under the transducer face. A pit two centimetres away isn't seen.
How it is solved: by scanning each area instead of measuring a point, and keeping the lowest value.
With the QS5: it holds the minimum (and maximum) on screen as you slide the transducer, so there is no need to watch the reading. And its B-Scan draws the thickness profile in real time: a pit shows up as a dip in the graph.
Problem 2: corrosion or poor coupling?
The symptom: a low or unstable reading in a specific area. It may be a pit… or a lack of couplant.
Why it happens: an irregular back wall scatters the sound and weakens the echo, just like poor coupling.
How it is solved: by looking at the echo quality as well as the number, and repeating with proper coupling before drawing conclusions (see couplant gel).
With the QS5: the energy bar shows the strength of the received echo, and the material condition analyser warns when the back wall is irregular, the typical sign of corrosion or pitting. It is a prompt to measure that area in more detail, not a final result.
Problem 3: a point below the minimum allowable that goes unnoticed
The symptom: after hundreds of readings, nobody notices the one below the pipe's minimum thickness.
How it is solved: with an automatic warning at the moment of measuring.
With the QS5: alarms for minimum thickness (the allowable one for that pipe) and for material fault, with sound, light and on-screen warning.
Problem 4: being unable to compare with the last inspection
The symptom: there are readings from a year ago, but nobody knows exactly which points, and wall loss per year can't be calculated.
How it is solved: by always measuring on the same grid of points and storing each reading with its position.
With the QS5: up to 32,000 readings in files organised in rows and columns, with date, time and statistics, transferred to PC with dmq DataCenter.
The QS3 also holds the minimum value and stores readings, but has no B-Scan or analyser: it is the option for thickness checks without corrosion mapping.
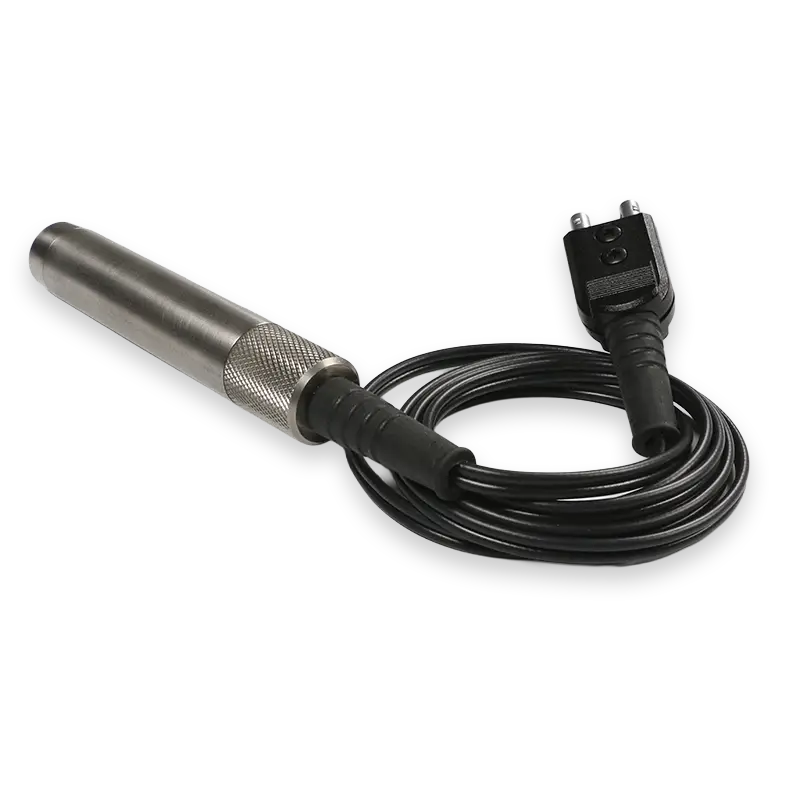
Which transducer to use
| For… | Transducer | Range and temperature |
|---|---|---|
| General purpose | 5 MHz · Ø10 mm | 1 – 300 mm -10 to 40 °C |
| Thin walls and small diameters | 7 MHz · Ø6 mm | 0.8 – 70 mm -10 to 40 °C |
| Thick walls or attenuating materials | 2 MHz · Ø12 o Ø22 mm | 4 – 500 mm -10 to 40 °C |
| Hot pipes | 5 MHz · Ø10 mm, alta temperatura | 1 – 250 mm up to 150 or 350 °C |
| Painted pipes (echo-echo, QS5 DLE) | 5 MHz · Ø10 mm Hi-Damp | 2.5 – 25 mm under paint -10 to 70 °C |
On small-diameter pipes, the smaller the transducer face, the better it sits on the curve. For walls below the transducer's minimum, see the "doubling" mistake below.
Sources: DEMEQ, QS5 user manual (B-Scan, material condition analyser, alarms, memory) and QS transducer specifications published by DEMEQ.
Other common mistakes
Trusting a reading that is too high on a heavily corroded area
If the wall has dropped below the transducer's minimum thickness, the gauge may show double (or even triple) the real thickness: this is the "doubling" effect. When a reading doesn't match what you see, check with a lower-range transducer, such as the 7 MHz one.
Measuring a hot pipe with a cold calibration
Temperature changes the sound velocity in the steel and in the transducer. Use a high-temperature transducer and calibrate at the pipe temperature.
Measuring a painted pipe in pulse-echo
The paint adds to the reading, with an error larger than its own thickness, and can hide wall loss. Measure in echo-echo with the QS5 DLE or on an unpainted spot.
Pipe in production, not in service? For measuring wall thickness in line, during extrusion, it's a different instrument: the QST multichannel gauge. See the guide pipe wall thickness during production.